GPS Positioning Using U-Blox

GPS Precise
Point Positioning of stationary rover Using U-Blox
· Setting
U-Blox for recording Data
U-Blox
Antenna has to be placed in a way that it receives signals without getting
blocked by objects and also minimal effect from reflections.
So
it would be better to place it in an isolated place without environmental
hindrance.
If
the experiment is done at ground level it would be better to use tripod stand
to mount the U-Blox antenna at least at a height of 1.5 m to minimize the
effect of people walking around.
And
also a small ground plane metal plate (5-7 cm) to prevent the reflection from
ground. Same applies to other altitudes also.
Accuracies of the positions obtained
increases with the amount of recorded data hence it would be better to record
raw data for 30 minutes.
As we are calculating the precise
position of a stationary object keep the Antenna stationary.
· Recording Data using U-Center
U center will
record the data in .UBX format.
Connecting the receiver
U-Blox window
appears as follows.
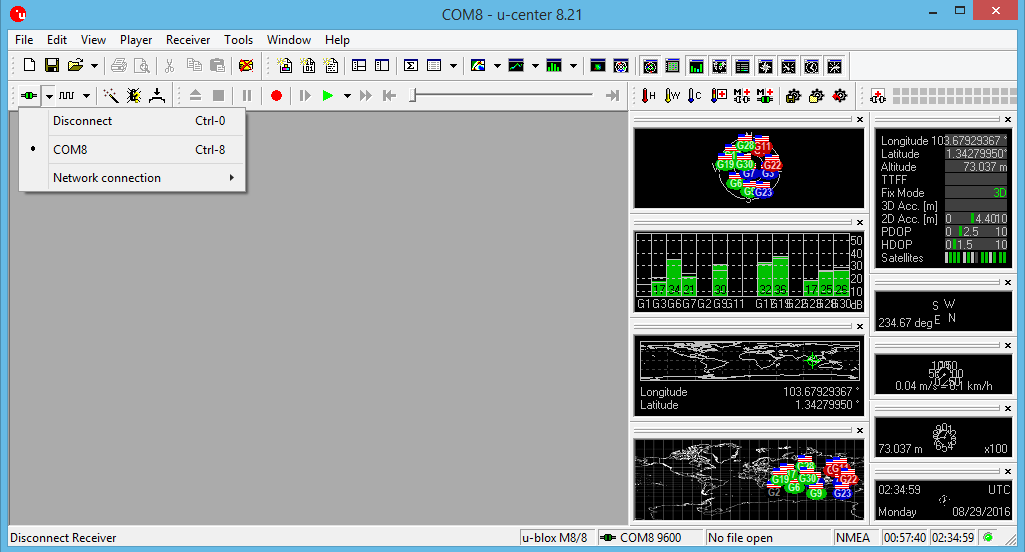
Setting the Starting Configuration
There are 3 starting configurations as
Hot Start, Warm Start and Cold Start. Hot
start do not delete any information saved in U-Blox hardware and can be used if
you are using the U-Blox frequently and in the same place. Warm start deletes
only the Ephemeris data and can be used if you are using U-Blox after some time
a like a week or if you are using it in different place from the previous
locations. Cold start can be used if you are using the U-Blox for the first time
or after a long time.
If cold start is used it would be
better to let the U-Blox to get the deleted data for about 20 minutes before
starting to record.

Recording Configurations
Configuration has to be set to receive
the appropriate information for positioning. In case GPS satellites are used
for positioning
Go to View > Configuration View > GNSS and Enable GPS only.

After that you have to set the data
format to be recorded.
Go to View>Message View>UBX>RXM (Receiver Manager).
Enable UBX-RAWX and UBX-SFRBX. (U-Blox
M8T).
Although we only need the UBX-RAWX and
UBX-SFRX to be recorded additionally our U- Blox has to get the time stamp to
store the data.
Enable View>Message View>NMEA>GxGSV, GxGSA, GxRMC.

Now settings can be flashed to the
U-Blox Memory so that switching off does not affect the configurations.
View>Configuration View>CFG mark Save Current
Configurations and press Send.

Now we can view what are going to be
saved in the UBX file from
View>Packet console, Text Console
Now Data is ready to be recorded.
Recording the Data
Player>Record Give desired location and Name of the UBX file.
Wait for 30 minutes or more then Player>Stop and Eject. While
recording the data their recording pattern can be viewed by selecting either View>Deviation Map or View>Map View for
the latter one you map image of the recording positions have to be given as
input and should be calibrated with 3 known points.
Now data have recorded and now have to
be processed.
· Data Processing Using RTKLIB.
We can use
either RTKNAVI or RTKPOST for precise point position calculations.
v Procedure 1
: Data Processing Using RTKNAVI
Step1:
Double click rtknavi.exe and click box I to give Input.
UBX file have to be given as input.

Output has to be written to a file in NMEA format to be used
again by u-center using Deviation Map.

Positioning mode has to be set as PPP Static as we have to be
find the location of lone stationary receiver.
Go to Options >
Settings1

Step2: Now press Start button to run the process. Positions can be plotted in map or
graph where you can see how the locations are changing. It would be useful when
we are tracking the position of a moving rover with time.

Once it finishes running output will be saved
to NMEA file. This file contains
processed position details with time. In order to find the average position of
the stationary rover U-Center Deviation Map can be used.
Output also
can be saved as .POS file by selecting Lat/Lon/Height
format which can be opened from Notepad and contains processed position details
which can be plotted using To KML… discussed
in the last Part of step2 in RTKPOST.
v Procedure 2
: Data Processing Using RTKPOST
Step1:
As like RTKNAVI, RTKPOST can be also used to process the data. For that
RTKCONV has to be used to .ubx file to RINEX files (.obs and .nav file format
in case of GPS) so that they can be processed by RTKPOST.

Provide the
raw .UBX data to the input directory and .nav and .obs data files will be save
to the output directory.
Now click Convert Button to convert the files to
RINEX.
Step2: Click Process Button. RTKPOST will
be opened itself.
Converted
obs. file has to be given as input here. In the Options dialog box Settings1
positioning mode has to be set as PPP Static.
Further in Output the Solution for the Static mode have to be set as All. And output again in NMEA format.


Now Execute
the process so that the output will be saved as NMEA file in the desired output
directory.
Then this
can be exported to U-Center to find the average of these processed positions.
By setting
output to LAT/LON/HEIGHT and solution
to Single Precise position can be
obtained in a .POS file. But for good accuracy Deviation Map can be used.
Step3 (Optional): Plot can be viewed using Plot and also position can be plotted in
Google Earth using To KML…

.POS file
can be given as input and output file can be opened using Google Earth
Application.
· Using U-center Deviation Map for Averaging
positions.
Once it
finishes running output will be saved to NMEA file. This file contains processed position details
with time. In order to find the average position of the stationary rover
U-Center Deviation Map can be used.
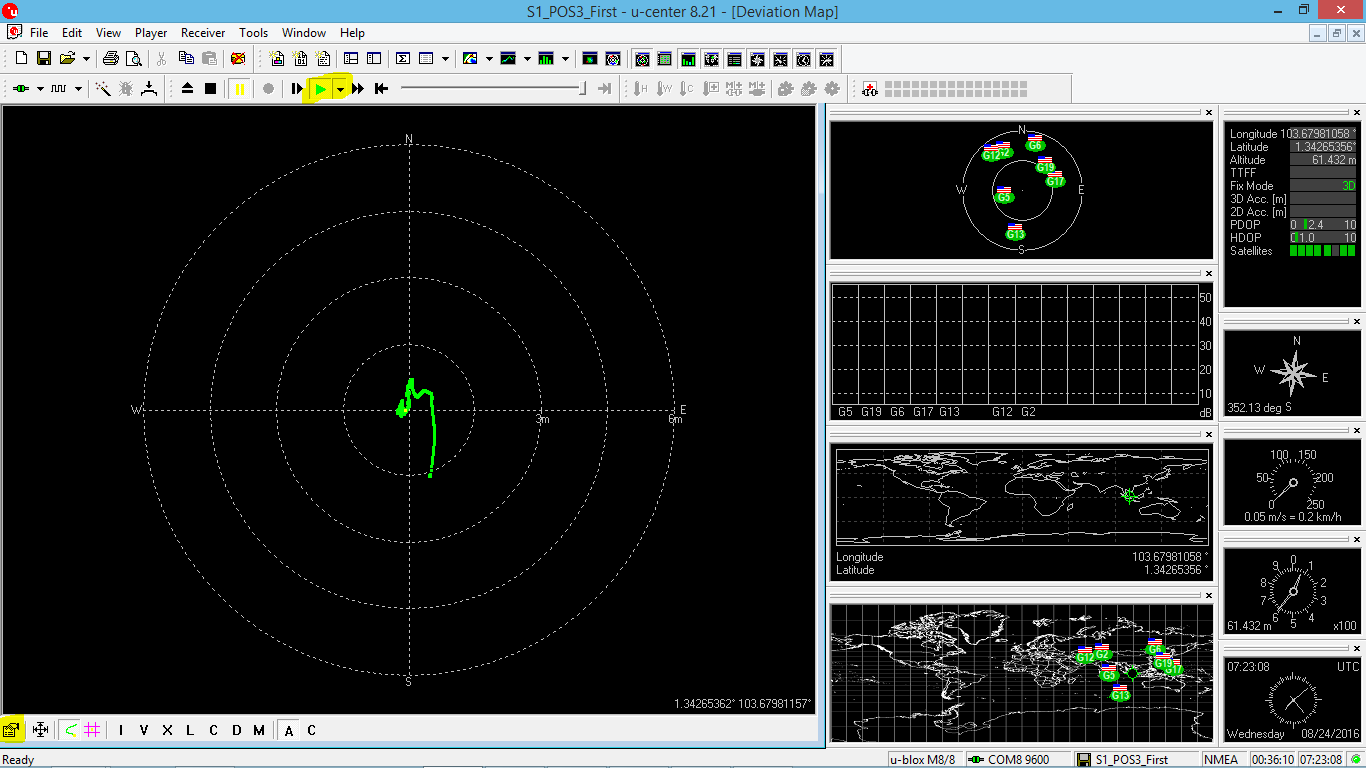
Open U-
Center and press green Play button, a dialog box appear give the location of
your NMEA file. It starts plotting. Plotting speed can be adjusted selecting
necessary speed in the dropdown menu near the play button.
In the
meantime go to view>Deviation Map
to view the Deviation Map.
Press the
Highlighted Button in the left bottom corner. Select average to get the average
latitude and longitude positions.
These are
the final value for the Precise Point Position of the U-Blox Antenna.

This final
value can also be converted to KML file by editing a .POS file and manually
writing the Latitude and Longitude values in the file. And then following the
steps in Step3 RTKPOST.
· Verification of Results
Results can
be verified using a one or two methods.
Ø Using the Google Earth and verifying
in the map. Can be done by just entering the latitude and longitude locations
in the search bar or can be converted to .pos file and then converted to .kml
file using RTKLIB and opening the file using Google Earth.
Ø Several readings and respective
precise positions can be found and their deviation distance can be found using
some online distance calculators and can be verified for the accuracy.
Deviation
Map will not provide Altitude Information but gives the Latitude and Longitude
Positions up to an accuracy of 1m or even less.
For altitude
RTKPOST Single output can be used.
RTKLIB and
Manuals can be downloaded from (Version 2.4.3 Supports U-Blox M8T):
http://www.rtklib.com/
U-Center
Software and the User Guide can be downloaded from: